A simple map of Mallapally Sub-District
In this first post on Maps we look to create a very simple map using R Programming.
For this project i used R (as usually) and worked with various libraries including ggplot and sf predominantly. I used the Overpass API at https://overpass-turbo.eu/ to collect the shapefiles. (A shapefile is a GIS file that contains various points and polygons for a given areas. ) A lot of the polygons are crowdsourced from the OpenStreetMaps (OSM) community. I used the sf package to open the shapefiles and plot them. I used ggplot2 to create the charts. A lot of the text formatting was done using the showtext package to handle fonts.
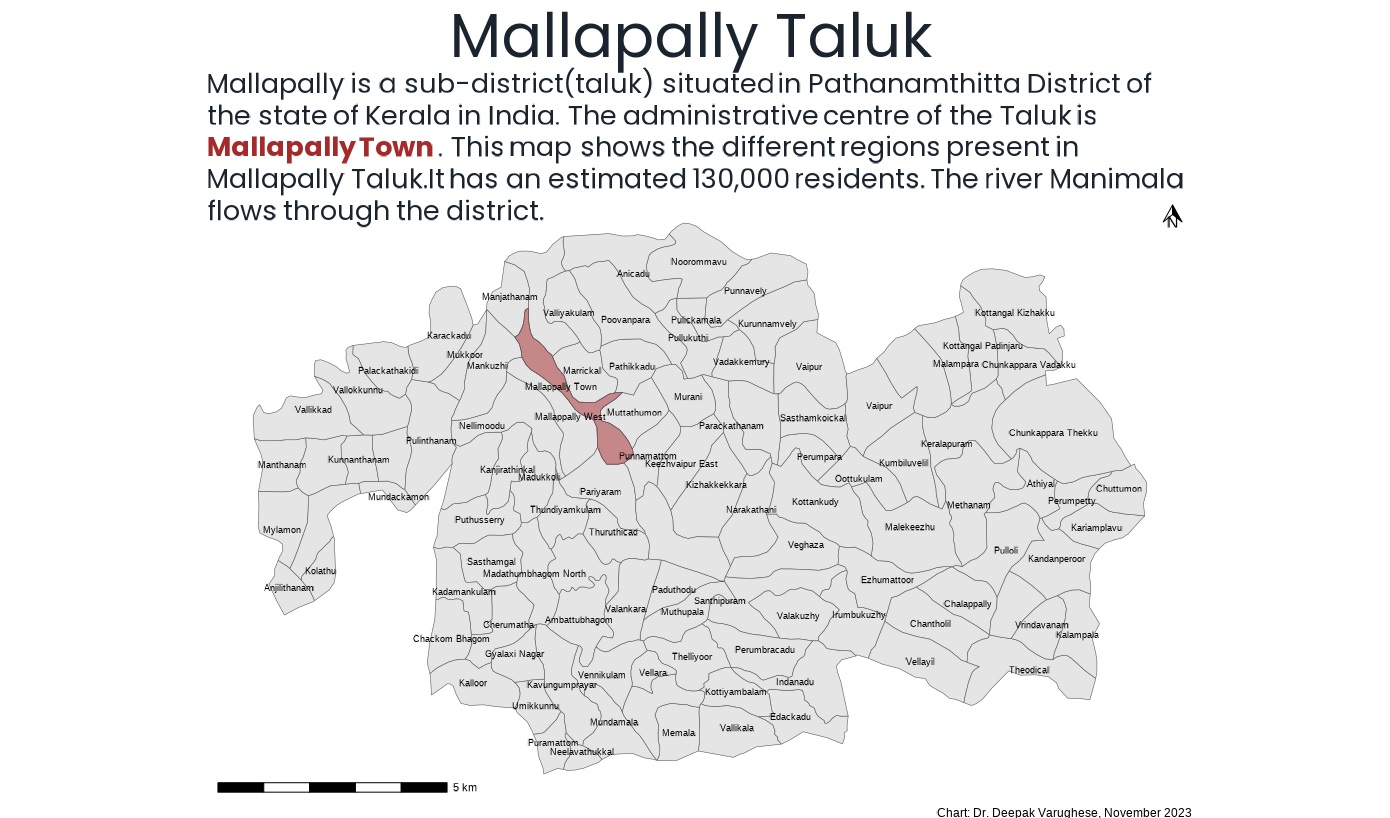
The map is a bit busy. While I would ideally consider making it an interactive map using leaflet I wanted to maintain today’s challenge as a chart. The labels look a bit crowded but i felt the purpose of the chart was labelling today so I kept that as is. I also highlighted the Mallapally Town in the map. I referenced the color by using the same color brown in the description so that it would act as a key of sorts. I have also stuck to good basics by adding a North Arrow and a Scale. This was added using the ggspatial package.
This was part one of this series. I hope to build on this chart in future.